FOODS OF INDIA
A virtual portal into the past two decades
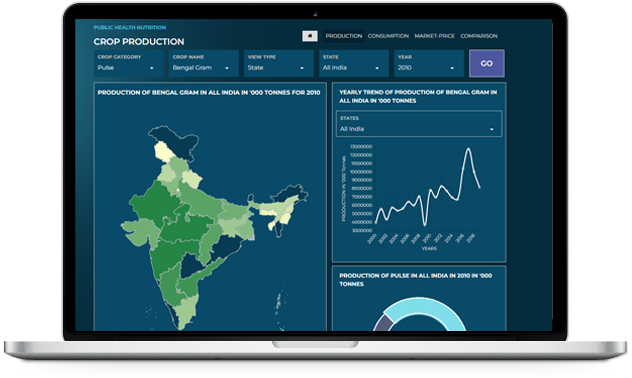
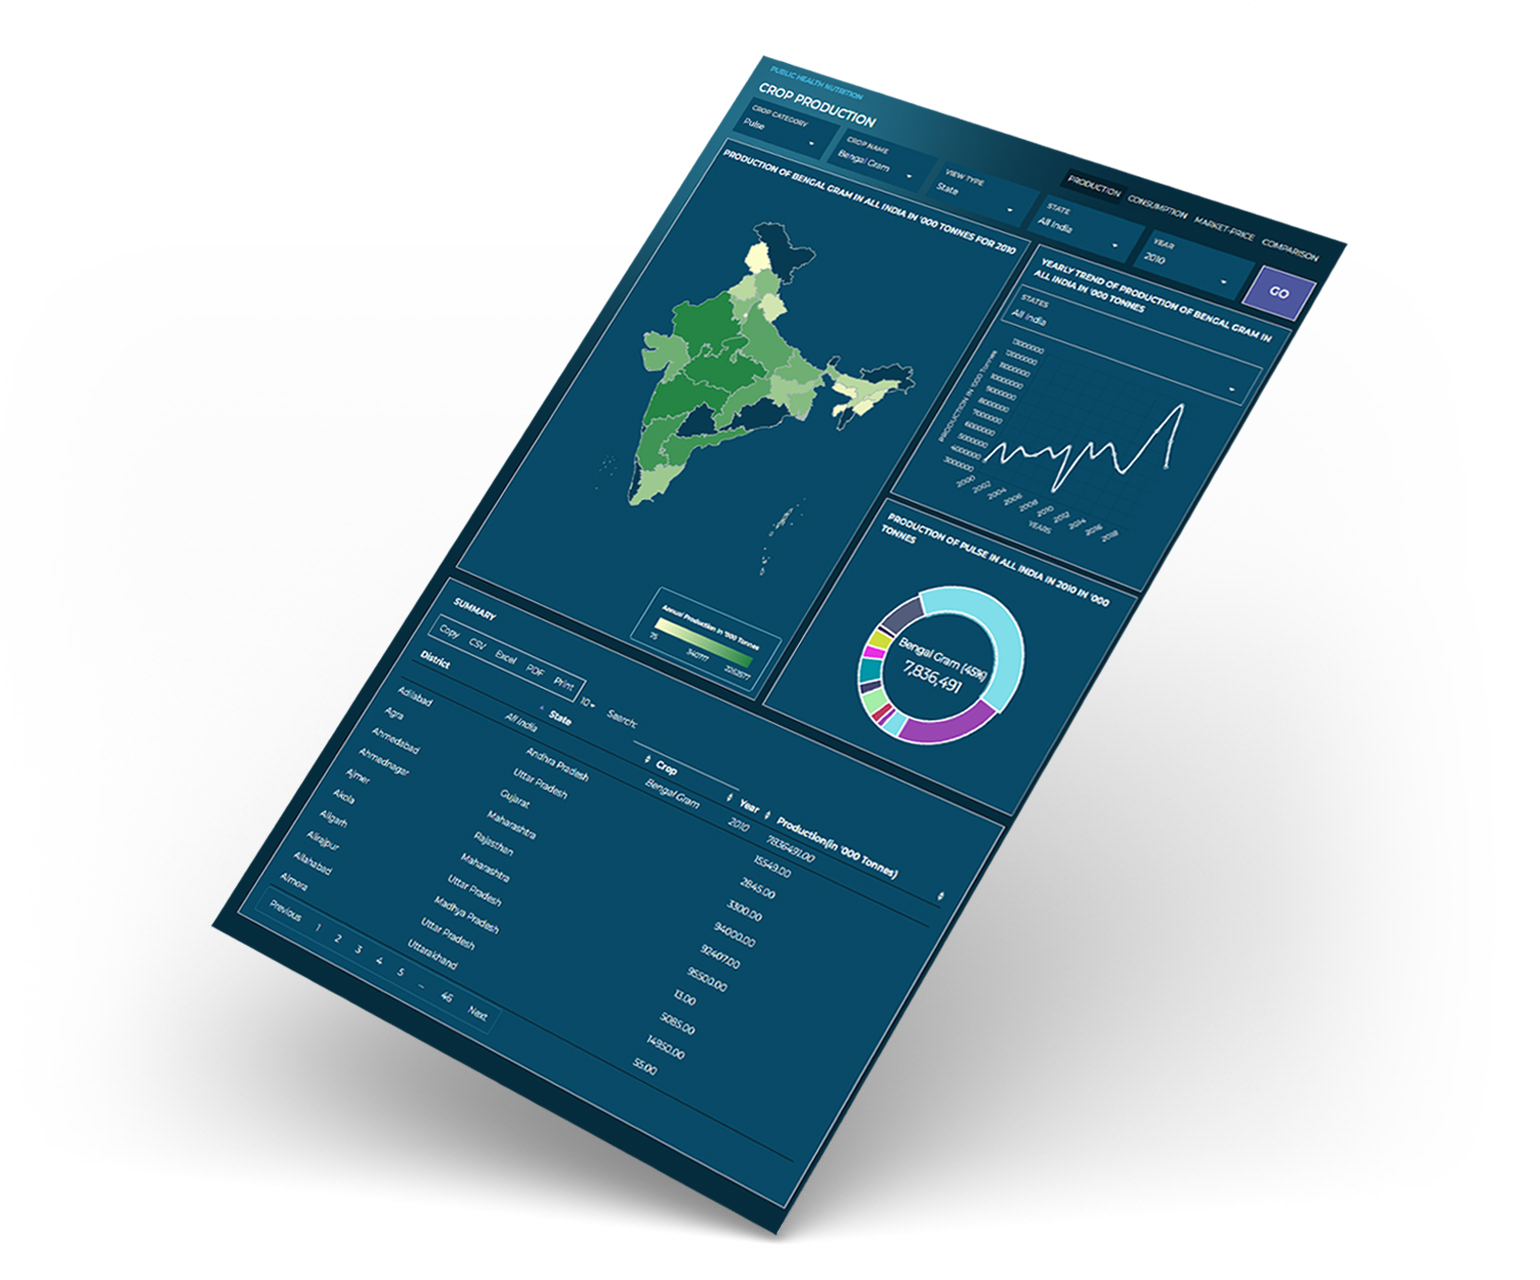
An extensive look into
Production of food crops
CROP PRODUCTION ACROSS INDIA AS SEEN THROUGH GRAPHIC ILLUSTRATIONS
A Comprehensive Analyis of
Consumption of foods
HOP ON A JOURNEY TO EXPLORE THE DIVERSITY OF CONSUMPTION OF FOODS ACROSS INDIA
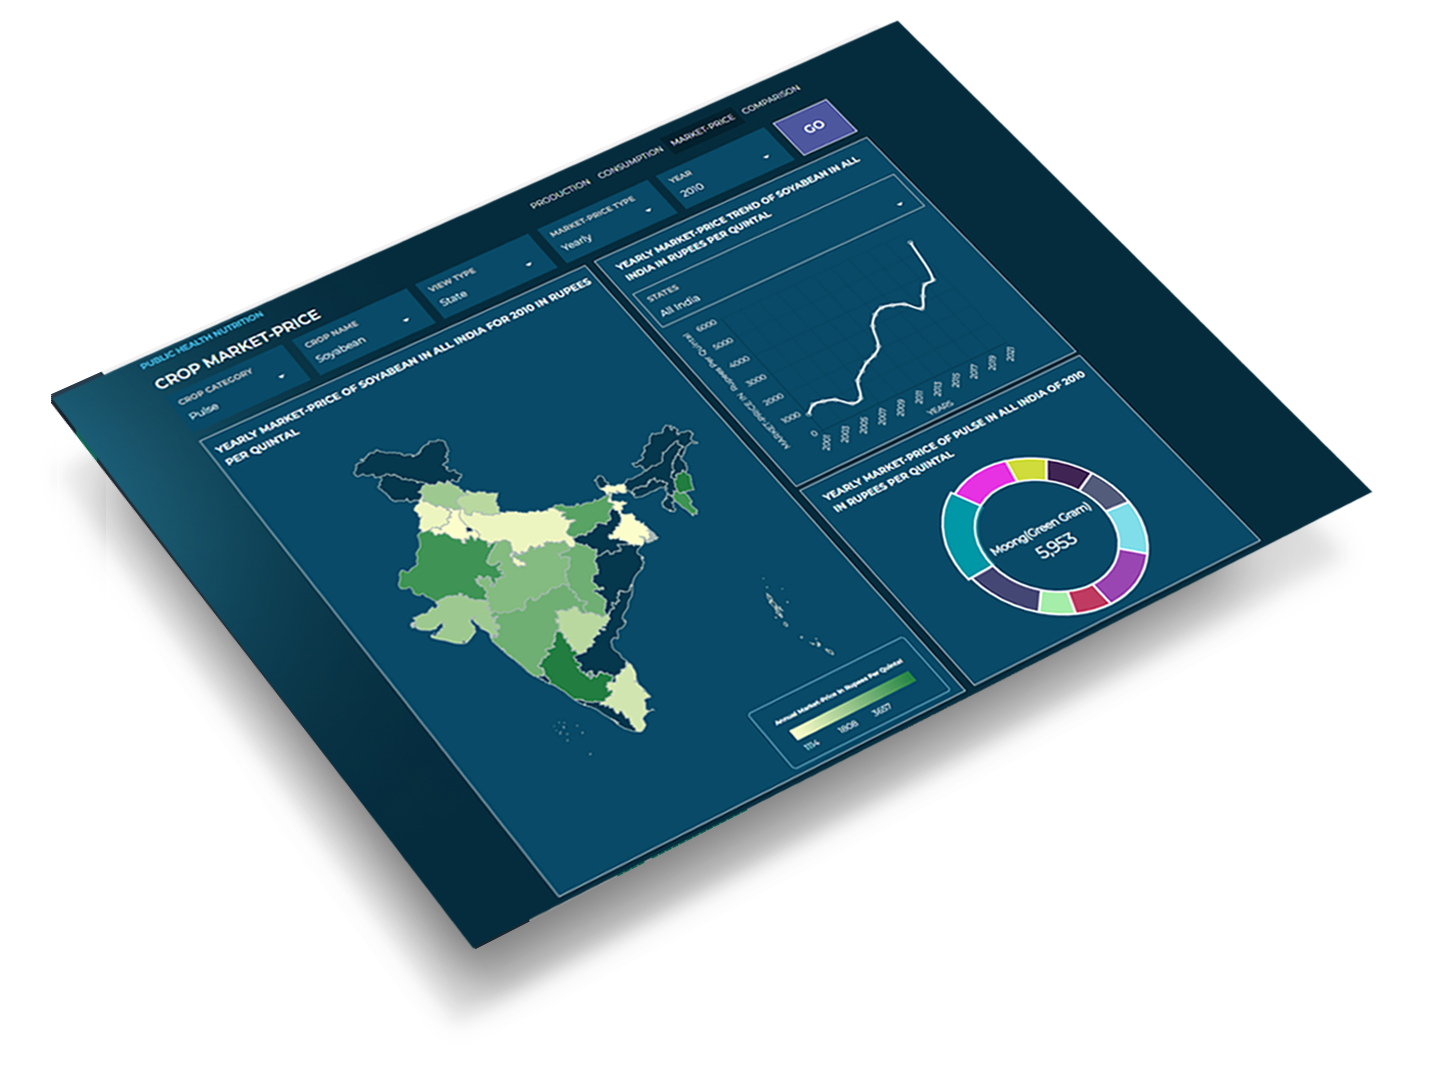
Understanding Trends
in Market-Price of foods
ENHANCED UNDERSTANDING OF THE MARKET-PRICE VARIATIONS OF FOODS ACROSS INDIA
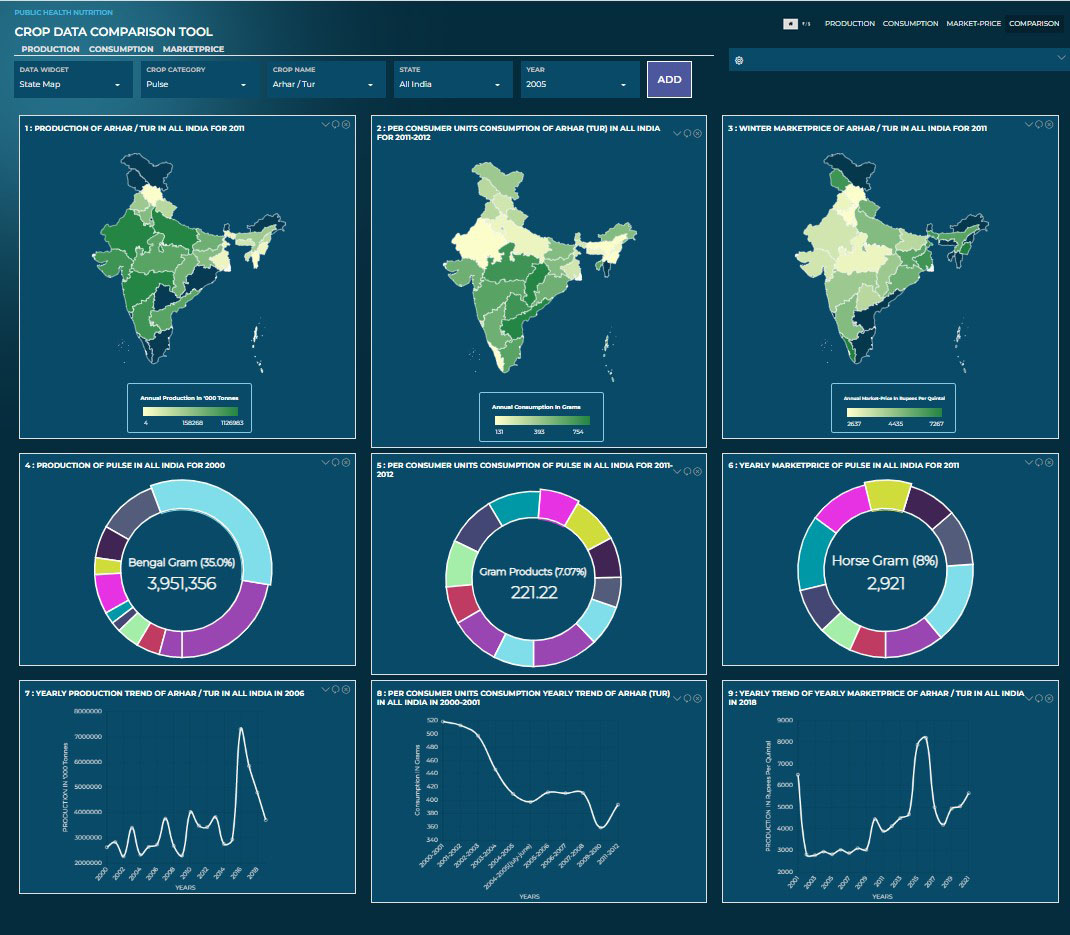
A peek into
FARMS, PLATES AND MARKETS
A CONCISE COMPARISON OF FOOD PRODUCTION, CONSUMPTION AND MARKET-PRICES